In the present study, titanium oxide (TiO2) nanoparticles, chitosan, and several nanocomposites containing different mass dosages of TiO2 and chitosan have been applied as the adsorbent for COD removal from the industrial wastewater (Bouali Sina Petrochemical Company, Iran). The FESEM, XRD, and FTIR tests have been employed to characterize TiO2 nanoparticles, chitosan, and fabricated nanocomposites. Then, the effect of adsorption parameters, including TiO2–chitosan mass ratio (1:1, 1:2, and 2:1), adsorbent content (0.25–2.5 g), temperature (20–50 °C), pH (3–11), solution volume (100–500 mL), and contact time (30–180 min) on the COD reduction has also been monitored both experimentally and numerically. The Box–Behnken design of the experiment approves that TiO2–chitosan (1:1), adsorbent content of 2.5 g, temperature = 20 °C, pH 7.4, solution volume of 100 mL, and contact time = 180 min are the condition that maximizes the COD removal (i.e., 94.5%). Moreover, the Redlich–Peterson and Pseudo-second order models are the best isotherm and kinetic scenarios to describe COD removal’s transient and equilibrium behaviors. The maximum monolayer COD adsorption capacity of the TiO2–chitosan nanocomposite is 89.5 mg g −1 . The results revealed that the industrial wastewater COD is better to remove using the TiO2–chitosan (1:1) at temperature = 20 °C.

The amount of oxygen required to oxidize organic pollutants in wastewater is defined as either COD (chemical oxygen demand) or BOD (biological oxygen demand) 1 . It is possible to employ chemical 2 , physical 2 , and biological 3 scenarios, such as adsorption 4,5 , nano-adsorption 6 , membrane 7 , ion exchange, electrocoagulation 8 , bio-flocculation 9 , sewage sludge 10,11 , and filtration 12,13 for the treatment of waste streams. Indeed, those separation processes that utilize the solid porous materials (i.e., adsorption) are among the most popular techniques due to their economic/operational features and a high achievable removal efficiency 14,15,16 . Generally, the advantages of adsorption process relative to other methods are: high performance, low cost, wide pH ranges, and easy operation. In the other hand, the waste product and low selectivity are some of the main disadvantages of adsorption process 17 .
Now a day, nano-scale solid materials have successfully improved properties of working fluids 18,19 , alloys 20,21 , and polymers 22 , efficiency of solar collectors 23 , and performance of wastewater treatment processes 24 . Keshtkar et al. utilized the synthesized alumina nanoparticles with different specific surface areas to adsorb nickel ions from synthetic wastewater 24 . Esmaeili-Faraj et al. studied the desulfurization of an actual diesel fuel sample by applying the alumina/polymer nanocomposite from numerical and experimental perspectives 25 .
The chitosan-based nanocomposites have been widely used for water/wastewater treatment 26,27 . This popularity is associated with the chitosan’s low cost and its amino or hydroxyl functional groups. Chung examined the applicability of chitosan with various deacetylation degrees for treating aquaculture wastewater 28 . The optimum COD removal of 69.7% has been reported for the chitosan with a 98% deacetylation degree. Dionisi et al. inspected the impact of chitosan adsorbent and pH on the pollutants’ elimination from the pot ale wastewater 29 . Thirugnanasambandham and Sivakumar focused on the zinc oxide-chitosan nanocomposite to efficiently treat the milk processing industry wastewater 30 . It has been reported that COD and turbidity can be reduced by applying the zinc oxide-chitosan nanocomposite. The adsorption efficiency of Chitosan-Citral Schiff for the treatment of a dairy industry’s wastewater was studied by Tsaneva et al. 31 . The maximum COD removal efficiency was approximately 35.3% under the optimum condition. Ligaray et al. studied the applicability of the bentonite-chitosan composite for COD removal from an industrial wastewater stream containing an initial COD concentration of 1348 ppm 32 . The maximum COD removal of 73.34% has been achieved at the optimum condition. The kinetic of removal of heavy metals (Copper, cadmium and chromium) from wastewater using chitosan based adsorbents have been studied by Prakash et al. 33,34,35 .The results show that that pseudo second order kinetic model correlates better with the experimental data 33,34,35 .
Titanium dioxide (TiO2) nanoparticles are non-toxic, photochemically stable, and possess a strong oxidation ability 36 . The TiO2 nanoparticles have been extensively utilized as either photocatalyst or adsorbent for the COD removal from wastewaters 37,38 . Belessi et al. examined the simultaneous removal/adsorption of COD and reactive red 195 from aqueous solutions employing the TiO2 nanoparticle 39 . The photocatalytic removal efficiency of COD from sewage using the TiO2 catalyst has been studied by Toke and Ingale 40 . Goutam et al. synthesized the green TiO2 nanoparticles and investigated their performance for tannery wastewater treatment 41 . The results state that the fabricated green TiO2 nanoparticles remove 82.26% and 76.48% of the COD and Cr (VI) ion, respectively. Utilizing pure TiO2 nanoparticles as a photocatalyst for COD removal has several limitations, including inadequate UV (ultraviolet) irradiation, small oxidative performance, and high cost 42 . Improving the surface properties of nanoparticles by the co-adsorbent is a technique suggested to overcome the TiO2 limitations and increase its COD removal efficiency from wastewater. Rojviroon et al. applied the synthesized TiO2-activated carbon by the sol–gel method to remove the COD and dye from the landfill leachate 43 . Maleki et al. concentrated on the ethylene dichloride removal from wastewater using the TiO2–graphene catalyst 44 . Li et al. investigated the electrocatalytic characteristics of the fabricated TiO2–SiO2/GAC particle for COD removal 45 . Recently, the TiO2–chitosan nanocomposite has been employed to remove organic acids, heavy metals, and dyes. The degradation rate of Rhodamine B using the TiO2–chitosan nanocomposite was reported by Zhang et al. 46 . Chen et al. used the thiourea-modified chitosan–TiO2 nanocomposite for removing 2,4-dichlorophenol and Cd(II) ions from an aqueous solution 47 . Farzana and Meenakshi investigated the degradation of methylene blue, reactive red2, and Rhodamine B, by the TiO2–chitosan composite by measuring the solution COD 48 . Wibowo et al. compared the BOD and COD reduction ability of zeolite, TiO2–chitosan, and TiO2-bentonite composite 49 . Ali et al. used the TiO2–chitosan fibers supported zero-valent nanoparticles for the organic compound removal 50 . The ability of the ion-imprinted TiO2–chitosan adsorbent was also studied for nickel removal from aqueous solutions 51 . Tao et al. used the TiO2–chitosan hybrid film to absorb lead from aqueous solutions 52 . Nawi et al. examined the impact of operating parameters on the anionic dye (reactive red 4) removal capacity of the TiO2–chitosan nanocomposite 53 . The efficiency of TiO2–chitosan nanofibers for metal ions sorption was investigated by Razzaz et al. 54 .
However, little research has focused on the TiO2–chitosan nanocomposite ability for COD removal from industrial wastewater. Therefore, this work applies the TiO2–chitosan nanocomposite as an efficient medium for COD removal from industrial wastewater (Bouali Sina Petrochemical Company, Iran). The characteristics of TiO2, chitosan, and fabricated TiO2–chitosan nanocomposites have been determined using FESEM, XRD, and FTIR tests. The BBD (Box–Benkhen design of experiment) investigates the effect of adsorption parameters (i.e., temperature, pH, contact time, TiO2–chitosan mass ratio adsorbent content, and solution volume) on the COD removal from the wastewater. Moreover, the optimum operating condition that maximizes the COD removal from the industrial wastewater using the TiO2–chitosan nanocomposite has been determined. The best kinetic and isotherm models for describing the transient and equilibrium COD removal measurements have been introduced, and their associated parameters are accurately adjusted.
Chitosan (molecular weight = 100 kDa, 99% degree of deacetylation), and TiO2 nanoparticles have been bought from Sigma-Aldrich, USA. Acetic acid and sodium chloride have been purchased from Fluka, Germany. All experimentations have been done using distilled water.
The TiO2–chitosan nanocomposite was synthesized based on the procedure described by Zainal et al. 55 . Briefly, 2.5 g chitosan nanoparticles were dissolved in 40 mL NaCl (molarity = 0.2) and 30 mL acetic acid (molarity = 0.1) under 12 h of stirring. Then, 2.5 g, 1.25 g, or 5 g TiO2 powder (depending on the composite content, i.e., 1:1, 1:2, or 2:1) and 50 mL acetic acid (molarity = 0.1) were added to the previous solution and mixed for more than 24 h until a homogenous solution of TiO2–chitosan was reached. Finally, the solution was warm-up in an oven at 100 °C for 4 h until the solvent was completely evaporated and the TiO2–chitosan composite synthesized. Several composites with different mass ratios of TiO2 and chitosan (i.e., 1:1, 1:2, and 2:1) have been fabricated in the same way as described before.
This study characterizes the morphology of TiO2 nanoparticles, chitosan, and fabricated TiO2–chitosan nanocomposites applying the FESEM (field-emission scanning electron microscopy, MIRA3TESCAN-XMU) after gold coating. The functional groups of TiO2, chitosan, and TiO2–chitosan nanocomposites have been monitored utilizing the FTIR test (Fourier transform infrared spectroscopy, Perkin–Elmer Spectrum GX FTIR spectrometer). The Philips instrument (X’pert diffractometer) has been employed for recording the XRD (X-ray powder diffraction) profiles of chitosan, TiO2, and TiO2–chitosan composites at 25 °C (using CuKα radiations).
The performance of the fabricated TiO2–chitosan nanocomposites for reducing the wastewater COD was measured using the standard procedure of HACH. Indeed, the closed reflux method 56 in a HACH COD reactor (DRB200, Hach Co., Loveland) containing K2Cr2O7 (potassium dichromate) reagent has been applied to measure the wastewater COD ranging from zero to 1500 mg L −1 . Then, 2 mL aliquots were added to the COD vials at 150 °C for 2 h. The COD vials were cooled to room temperature and titrated with ferrous ammonium sulfate (molarity = 0.05). The solution pH adjusts using H2SO4 (molarity = 0.1) or NaOH (molarity = 0.1). After conducting the adsorption tests, the adsorbent separates from the extract through 10 min of centrifugation at 4000 rpm (Denley BS400 machine, UK). The TDS (total dissolved solids), initial pH, and COD of Bouali Sina Petrochemical Company wastewater are 574 mg L −1 , 7.3, and 0.97 g L −1 , respectively. Equation (1) expresses the mathematical formulation of the COD removal 57 .
$$>\;>\;\left( \% \right) \, = \frac - C_ >> >> \times 100$$where Ci and Co stand for the initial and final COD concentrations, respectively.The current research applies the four-factor three-level BBD (Box–Behnken design) scenario to investigate the impact of adsorption parameters [i.e., adsorbent content (0.25–2.5 g), contact time (30–180 min), pH (3–11), and solution volume (100–500 mL)] on industrial wastewater COD removal using TiO2–chitosan nanocomposites. The polynomial model for correlating the COD removal to the adsorption parameters is defined by Eq. (2) 58 .
where A0, Ak, Akk, Akz are the model’s coefficients. Xk, Xk 2 , and Xk Xz are the three combinations of the independent variables (linear, quadratic, and interactive). Table 1 summarizes the output of applying the design of the experiment to the adsorption parameters. This table also reports the experimentally-measured COD removal values (see “Effect of operating conditions on the COD removal” section), and their counterpart predicted values by a polynomial model (see “Statistical analyses of the adsorption experiments” section).
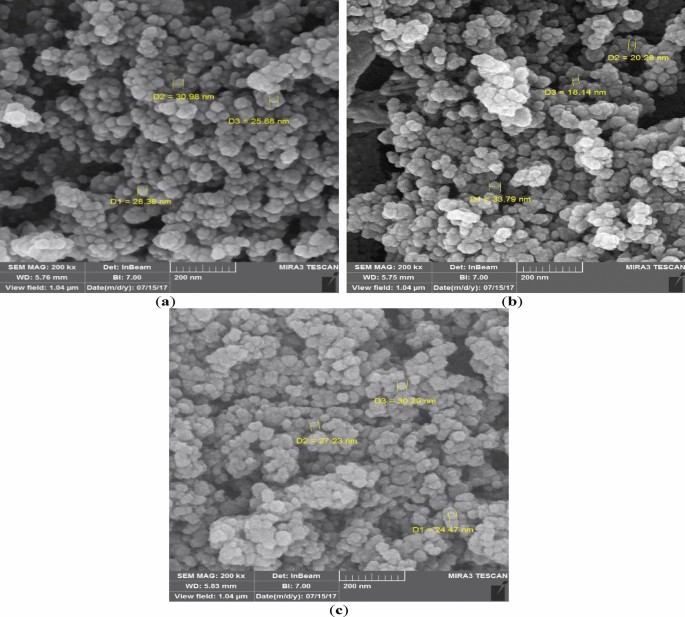
These characterization tests show that the TiO2, chitosan, and TiO2–chitosan nanocomposite are homogenous and have an average particle size of 30, 35, and 40 nm. It can also be seen that the chitosan and TiO2 were appropriately dispersed in the structure of the TiO2–chitosan nanocomposite. The morphology of the TiO2–chitosan has a particle size ranging from 15 to 60 nm.
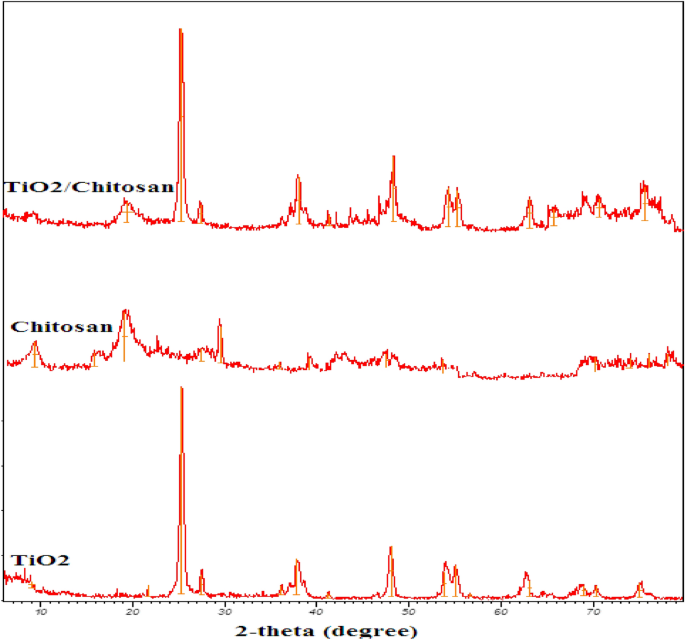
The XRD patterns of chitosan, TiO2, and TiO2–chitosan nanocomposite have been displayed in Fig. 2. The peaks observed at the 2θ = 25.3° (1 0 1), 48.1° (2 0 0), 56.6° (2 1 1), 62.7° (2 0 4), and 75.1° (2 1 5) could be related to the various diffraction planes of anatase form of the TiO2 nanoparticles. Whereas the peaks appeared at the 2θ = 27.5°, 37.0°, 54.3°, and 70.3° correspond to the various diffraction planes of nanoparticle rutile form 61 . The peaks corresponding to chitosan’s crystalline form appear at 2θ = 10° and 19.5°. The XRD pattern of TiO2–chitosan nanocomposite shows that the synthesized TiO2–chitosan nanocomposite possesses a crystallized form with peaks at 2θ = 19.2°, 25.3°, 48.1°, 62.7°, and 75°. Comparing the XRD patterns of TiO2–chitosan nanocomposite and TiO2 indicates the presence of chitosan peaks in the TiO2–chitosan nanocomposite structure. Moreover, no significant change in the anatase and rutile forms of the TiO2 nanoparticles has occurred. This observation approved that the TiO2–chitosan synthesis procedure maintains the characteristic structure of TiO2 nanoparticles.
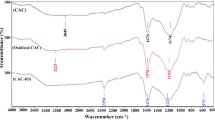
The FTIR spectra of TiO2 nanosized particles, chitosan, and TiO2–chitosan nanocomposite have been shown in Fig. 3. The absorption bands at 3720, and 1650 cm −1 are related to O–H and N–H groups of the polysaccharide. The stretching band at 1560 cm −1 could be associated with the amide content in the chitosan structure. The observed bond at 2924 cm −1 corresponds to the CH2 stretching groups. The observed bond at 2359 cm −1 shows the stretching carboxyl groups of chitosan. The absorption band around 1150 cm −1 describes the C–OH stretching vibration. The chitosan C–O stretching groups are detected at 1005 and 862 cm −1 .
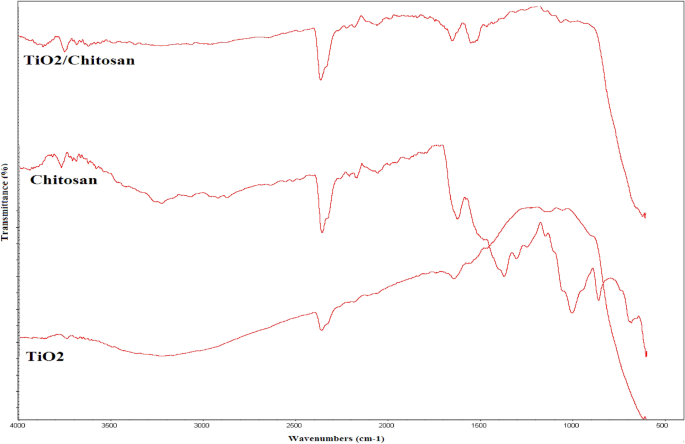
In the TiO2 nanoparticles’ FTIR spectrum, the absorption spectra at 3737, 3231, 2359, and 1642 cm −1 are associated with the hydroxyl groups. The observed band at 650 cm −1 revealed the existence of the TiO2 compound.
Moreover, the characteristic bands of the chitosan and TiO2 can be easily detected in the TiO2–chitosan nanocomposite’s FTIR spectrum. No significant differences are observable in the FTIR spectra of the chitosan, TiO2, and the synthesized TiO2–chitosan nanocomposite. It implies that the TiO2 addition into the chitosan structure produces no changes in the chitosan chemical structure. These observations approved that the TiO2 was physically loaded in the chitosan structure.
The effects of four influential factors (i.e., adsorbent content, contact time, pH, and solution volume) on the industrial wastewater COD removal have been measured at three working levels. Figure 4a shows the pH impact on the COD removal efficiency of the TiO2–chitosan nanocomposite. This figure states that increasing the solution pH up to 7 increases the COD removal, and after that, the COD removal efficiency of TiO2–chitosan nanocomposite decreases. Higher H + ion concentration in the acidic solution (pH of lower than 7) neutralizes the negative charge of the TiO2–chitosan surface and reduces the COD removal efficiency by the ion exchange. On the other hand, high OH - ion concentration in the alkaline/basic solution (pH of higher than 7) prevents the diffusion of organic materials into the TiO2–chitosan pores and decreases the COD removal 62 . Furthermore, the surface charge of the adsorbent depends on the solution pH. The zero charge point of a TiO2 in water is at pH ~ 6. At the alkaline range of pH, the positive surface charge of the adsorbent may be responsible for decreasing the COD removal efficiency of the TiO2–chitosan nanocomposite 40 . Similar results were also reported by other researchers 63,64 . The optimum pH value of 7 has been reported for maximizing the COD removal efficiency of some adsorbents for wastewater treatment of the coffee 63 and sugar 64 processing companies.
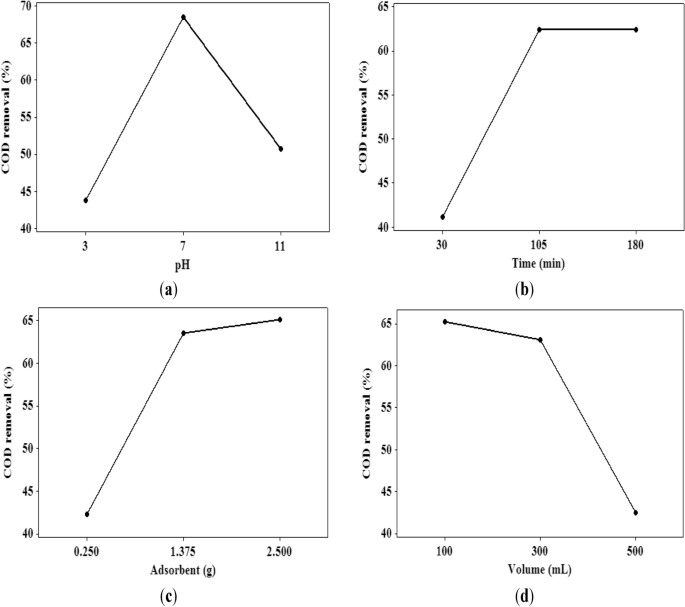
The influence of wastewater-nanocomposite contact time at three levels on the COD removal performance of the TiO2–chitosan adsorbent is depicted in Fig. 4b. It can be concluded that the adsorption capacity of the TiO2–chitosan nanocomposite increases by increasing the contact time. COD adsorption using the TiO2–chitosan adsorbent experiences the equilibrium state at contact time = 180 min. More than 90% of the total COD has been adsorbed at the first 105 min of the contact time. The sharp variation of the COD removal during the first 105 min of contact time is associated with the high number of active sites available at the TiO2–chitosan surface. After saturating surface-active sites, the organic matters require more time to diffuse through the TiO2–chitosan pores and adsorb on the pore walls of the nanocomposite. After 180 min of contact time, all the internal/external active sites of the TiO2–chitosan nanocomposite have been occupied, and the equilibrium state is reached. A similar trend has been reported for water removal from 2-dimethylaminoethylazide using calcium chloride and NaA zeolite 65 .
Figure 4c shows the influence of adsorbent content on the COD removal from industrial wastewater. This figure explains that increasing the adsorbent content increases the available active sites for pollutant adsorption and enhances the COD removal efficiency of the utilized nanocomposite. This figure also shows that the COD removal rate decreases by increasing the adsorbent content (> 1.375 g). Indeed, decreasing the available organic matter to adsorb on the active nanocomposite sites reduces the COD removal rate of a high nanocomposite dosage.
The impact of the effluent volume of wastewater/solution on the COD removal efficiency of the fabricated nanocomposite is illustrated in Fig. 4d. This figure indicates that increasing the solution volume increases the number of organic matters, rapidly saturates the available active sites of the nanocomposite, and decreases the COD removal. The low performance of the TiO2–chitosan nanocomposite for efficiently removing the COD of 500 mL of effluent volume is related to the rapid saturation of adsorbent sites. Indeed, the lower COD removal efficiency achieved for the high than the low wastewater effluent volume is connected to the higher COD needed to be adsorbed/removed by the same number of active sites.
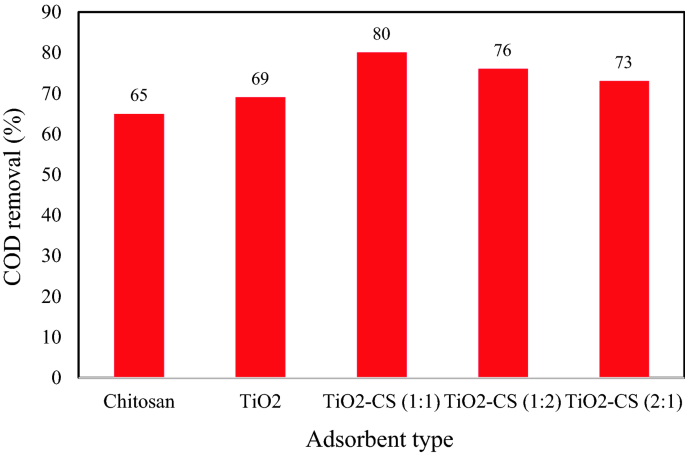
The COD removal ability of TiO2 nanoparticles, chitosan, and synthesized nanocomposites with mass ratios of 1:1, 1:2, and 2:1 of TiO2 and chitosan have been compared in Fig. 5. This graph shows that the maximum COD removal of 80% can be achieved by helping the TiO2–chitosan (1:1) adsorbent at pH 7, contact time 180 min, adsorbent content 2.5 g, and 300 mL solution volume. The COD removal ability of the utilized adsorbents has an order of TiO2–chitosan 1:1 (80%) > TiO2–chitosan 1:2 (76%) > TiO2–chitosan 2:1 (73%) > TiO2 (69%) > chitosan (65%). Therefore, the TiO2–chitosan with an equal mass ratio is the best adsorbent for COD removal from industrial wastewater.
Dependency of the COD removal efficiency of the TiO2–chitosan (1:1) nanocomposite 100 mL of the effluent solution (pH 7.4, adsorbent content = 1.375 g, contact time = 105 min) has been illustrated in Fig. 6. This figure approves the negative effect of temperature on the COD removal efficiency of the TiO2–chitosan nanocomposite. It means that the TiO2–chitosan adsorbent has the highest tendency to remove the wastewater COD at low temperatures. This behavior may be associated with increasing the internal energy of pollutants that helps them to detach from the adsorbent surface and escape into the solution bulk. Exothermic adsorption may be considered the next responsible for this observation 66 . Thus, both physical and ion exchange are possible to involve in the COD sorption process using the TiO2–chitosan nanocomposite. This observation has also been reported by other scientists 67,68 .
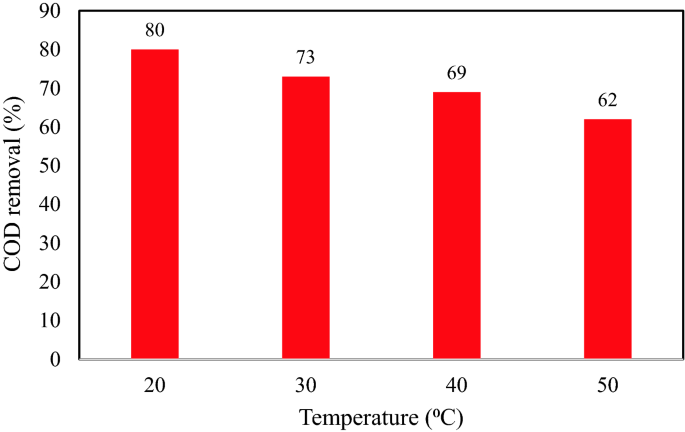
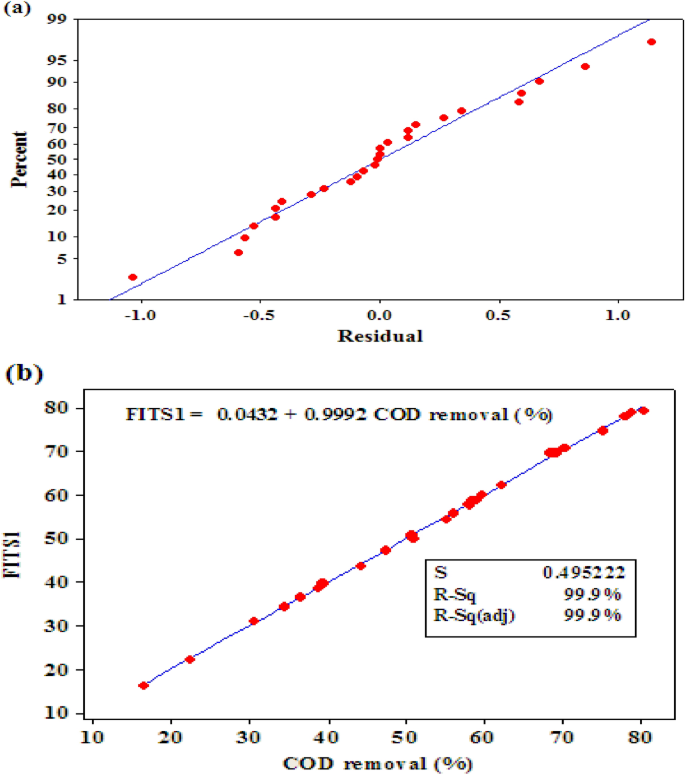
Table 2 summarizes the results of ANOVA (analysis of variance) performed to inspect the significance probability (p-value) of influential variables on the COD removal efficiency of the nanocomposite. Those independent variables with p < 0.05 at the 95% confidence interval significantly impact the COD removal 69 . The significant variables are necessary to include in the full quadratic model 70 . On the other hand, the insignificant variables (p > 0.05) should be removed from the full quadratic model 71 .
It is possible to locate the optimized values of the involved independent variables by solving Eq. (5). The optimum values of the solution pH, contact time, adsorbent content, and effluent solution volume are 7.4, 180 min, 2.5 g, and 100 mL, respectively. In this optimum condition, the maximum COD removal efficiency of the TiO2–chitosan nanocomposite is 93.67%. The experimental value of the COD removal under the optimum condition (i.e., 94.5%) is also in excellent agreement with the predicted optimized value.
Figure 8 exhibits several three-dimensional (3D) graphs for monitoring the dependency of the COD removal ability of the TiO2–chitosan nanocomposites on different combinations of influential variables. Each of these figures explains the combined effect of a pair of independent variables on the COD removal (the central level of the other two variables has been used to plot these figures). The surface plot of the estimated COD removal as a function of pH and contact time has been shown in Fig. 8a. The COD removal efficiency of the TiO2–chitosan nanocomposite increases by increasing the solution pH up to 7 and then decreases at higher pH values. This behavior was previously related to the variation of the adsorbent surface charge by the solution pH. Increasing the COD removal over time is related to the greater period available for organic matter to absorb on the nanocomposite surface and diffuse in its pores. The simultaneous effects of pH and adsorbent content (Fig. 8b) and pH and effluent solution volume (Fig. 8c) on the wastewater COD removal reveal that the optimum pH value is about 7. The couple effects of pH and contact time (Fig. 8a), adsorbent dosage and contact time (Fig. 8d), and contact time and volume solution (Fig. 8e) indicate that two different mechanisms govern the COD adsorption efficiency of the utilized nanocomposite over the time. In the first stage (up to 105 min), the fast COD adsorption may be related to the adsorption of organic matters on the external surface of the TiO2–chitosan nanocomposite. In the second stage, the organic matter diffuses through the TiO2–chitosan composite pores and throats and absorbs on the internal active sites.
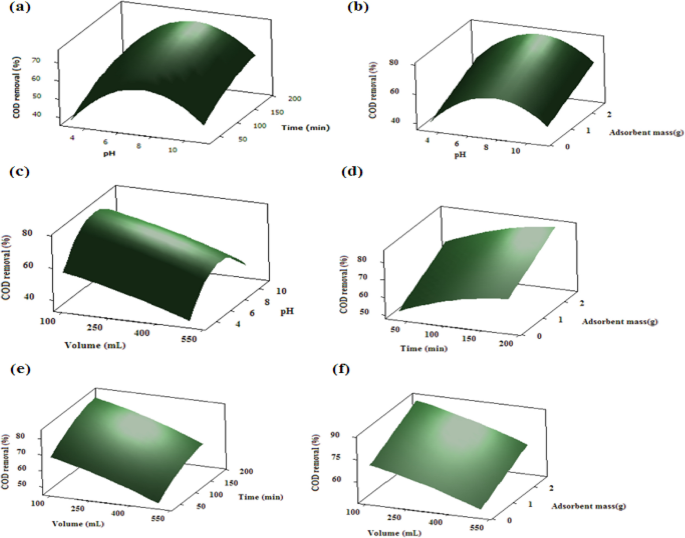
Furthermore, enhancing the COD removal by the TiO2–chitosan nanocomposite dosage can be related to increasing the available surface area and active sites for adsorbing pollutants (Fig. 8b,d,f). The simultaneous effect of volume and pH, adsorbent dosage, and contact time have been presented in Fig. 8c,e,f. These graphs state that increasing the effluent wastewater volume negatively affects the COD removal efficiency of the nanocomposite. An increase in the effluent wastewater volume increases the pollutant concentration, rapidly saturates the active sites, and reduces the COD removal ability of the nanocomposite.
Referring to Eqs. (3) and (4), the adjustable constants of the pseudo-1st-order and pseudo-2nd-order kinetic equations are shown by k1 and k2, respectively. Table 4 introduces the adjusted constants of the considered kinetic models, experimental and calculated values of the COD adsorption capacity at the equilibrium state, and the observed correlation coefficients. Since the pseudo-2nd-order has a higher correlation coefficient than that of the pseudo-1st-order kinetic approach, the earlier better describes the transient behavior of the COD removal by the TiO2–chitosan nanocomposite. Furthermore, the COD adsorption capacity obtained by the pseudo-2nd-order has a higher compatibility with the experimental measurements (R 2 = 0.993) than those provided by the pseudo-1st-order kinetic model (R 2 = 0.970). Thus, the pseudo-2nd-order kinetic model is chosen for modeling the transient behavior of the wastewater COD removal using the TiO2–chitosan adsorbent. This is close to the results discussed by Prakash et al. 35 .
Table 4 Kinetic parameters of COD sorption using TiO2–chitosan adsorbent.Three well-established isotherm models, namely Freundlich 74 , Redlich–Peterson 75 , and Langmuir 76,77 , have been employed to monitor the equilibrium behavior of the COD removal performance of the TiO2–chitosan nanocomposite. The mathematical form of Freundlich [Eq. (7)], Redlich–Peterson [Eq. (8)], and Langmuir [Eq. (9)] isotherms has been shown below.